Is your monetization strategy performing at its best? Or do you know how to improve your ARPU & Retention metrics?
These are some of the major questions every Mobile Developer & Publisher asks themselves when they need to scale an app.
With Appodeal, you can understand how you grow, scale, improve and adjust your Monetization Strategy.
The Appodeal Monetization Overview
From the Appodeal Monetization Overview, you can take control of everything:
- Find intuitive graphs of your revenue trends that will help you boost your ARPU, DAU, and revenue metrics!
- Boost your Engagement metrics, such as Session Length, Time Spent, Sessions count… Now, you can even find the number of impressions per user and session, for all your Ad Types & Units!
- And keep analyzing your familiar monetization metrics, such as Fill Rates, Display Rates, Ad Impressions, Requests, as you’ve always done!
Real Scenario #1: Why my Ad Revenues are going down?
But let’s take a closer look, and use the following real case scenario, and find out why your ad revenues are getting smaller:
First, the ARPU, or Average Revenue per User, can fluctuate for many reasons. Some of them could be:
- Your waterfall configuration,
- The quality of your traffic
- The seasonality of your app,
- Recent updates on your app,
- And many more.
It is extremely important that you quickly identify why your ARPU is decreasing, and fix it.
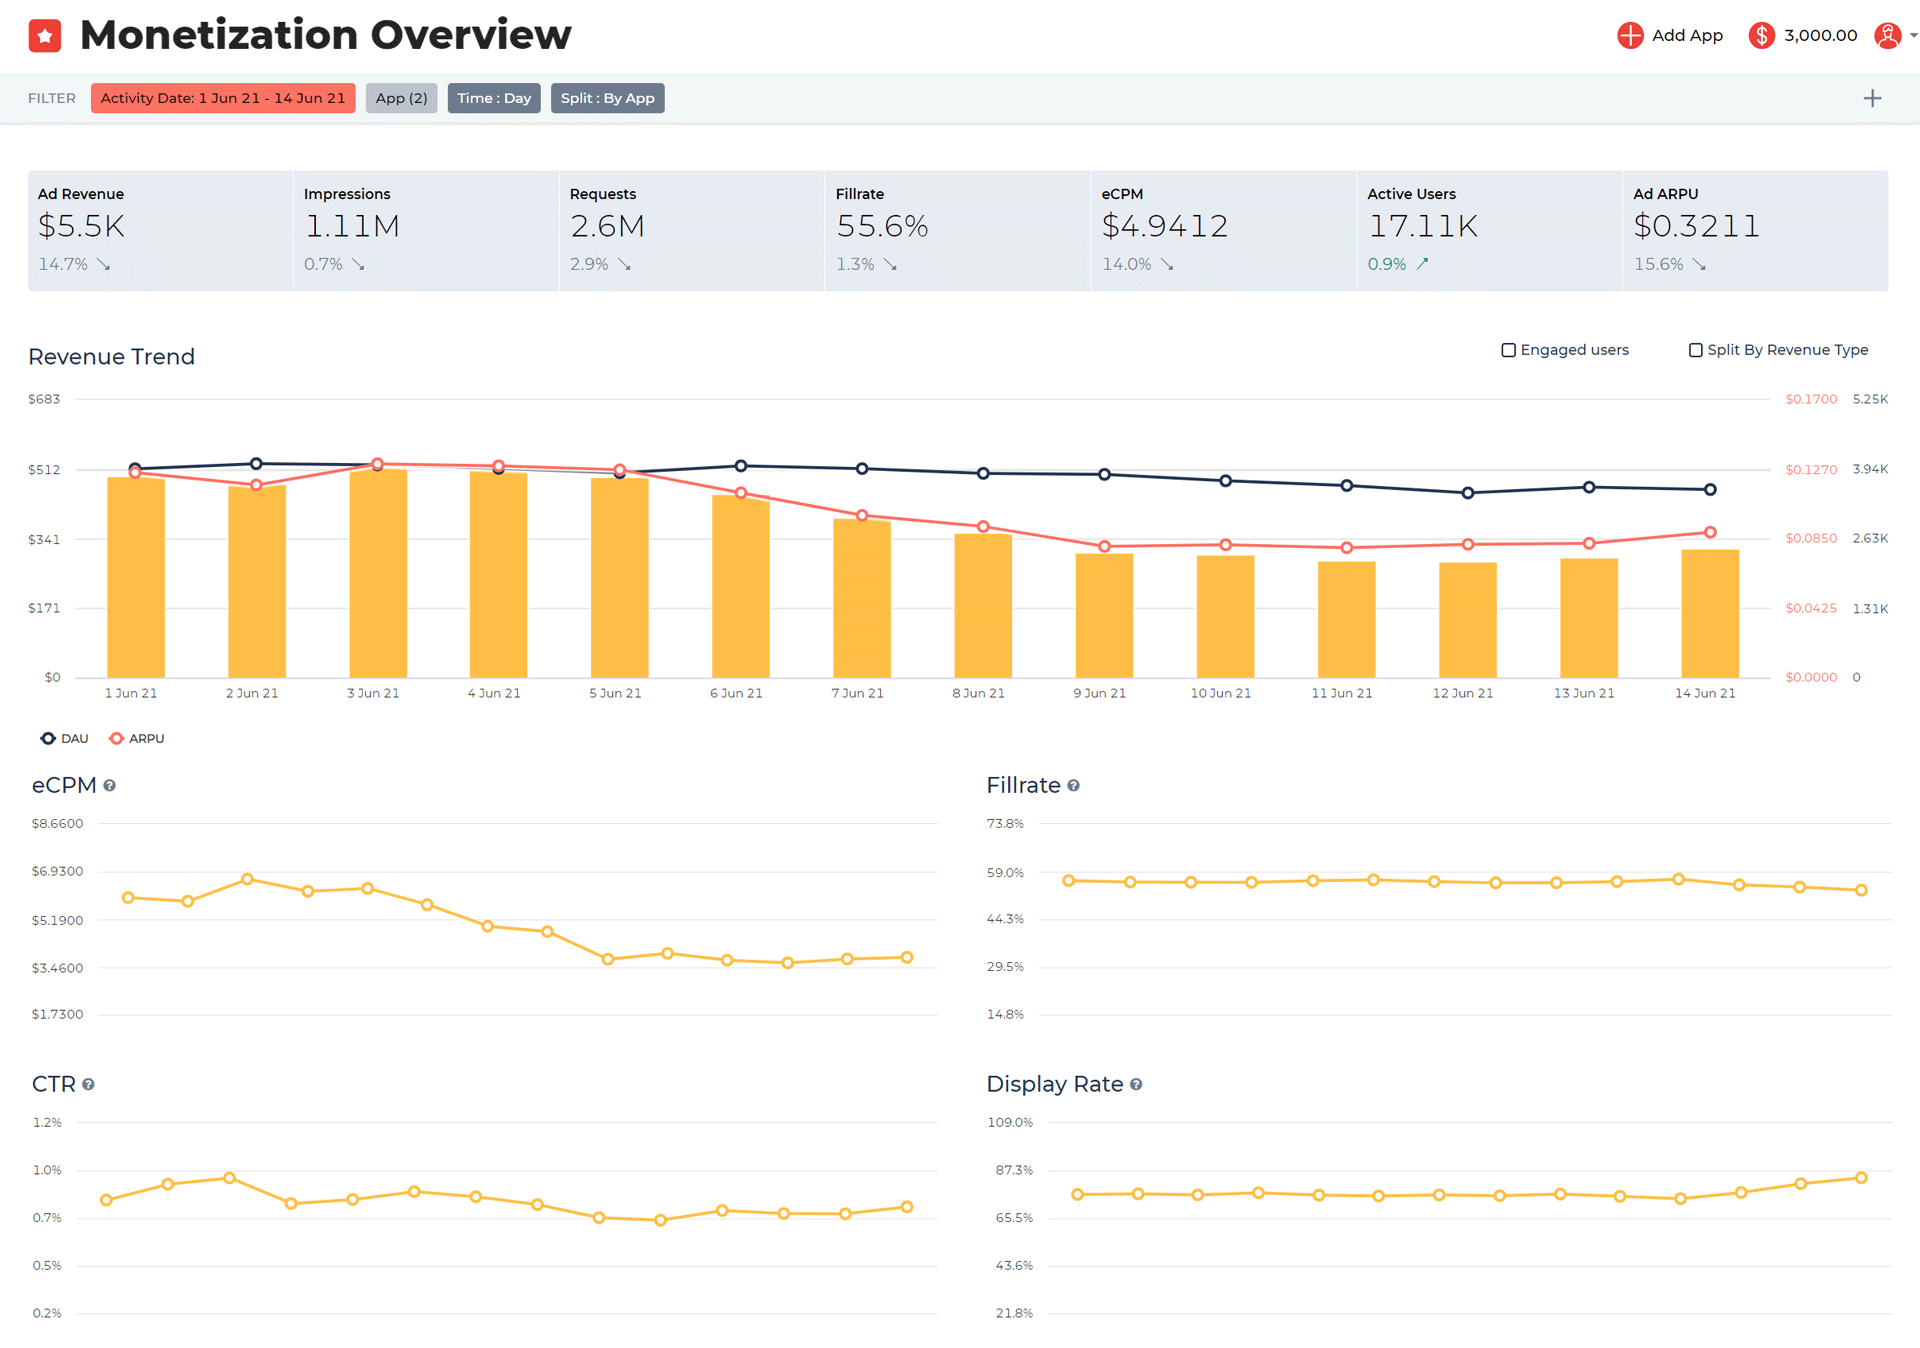
From your Appodeal Dashboard, and in a matter of minutes, you can create a detailed report that shows you, not only your revenue metrics but also all the other related data. This way, you can quickly spot any actual and future trends, and act on them.
In this screen, we can see this report that tells us how all the metrics have decreased compared to the previous period. And what’s more concerning, we can see a significant drop in the ARPU during the last two weeks.
Real Scenario #2: How external factors can affect your Ad Revenues
Let’s imagine that you haven’t made any changes lately, but still, your app revenues have decreased for several ad networks. This may suggest that the drop in your ARPU is because of an external factor.
By the timeframe used in this example, the most recent change is the latest update in the iOS policies, with the new IDFA regulations.
So, let’s check it:
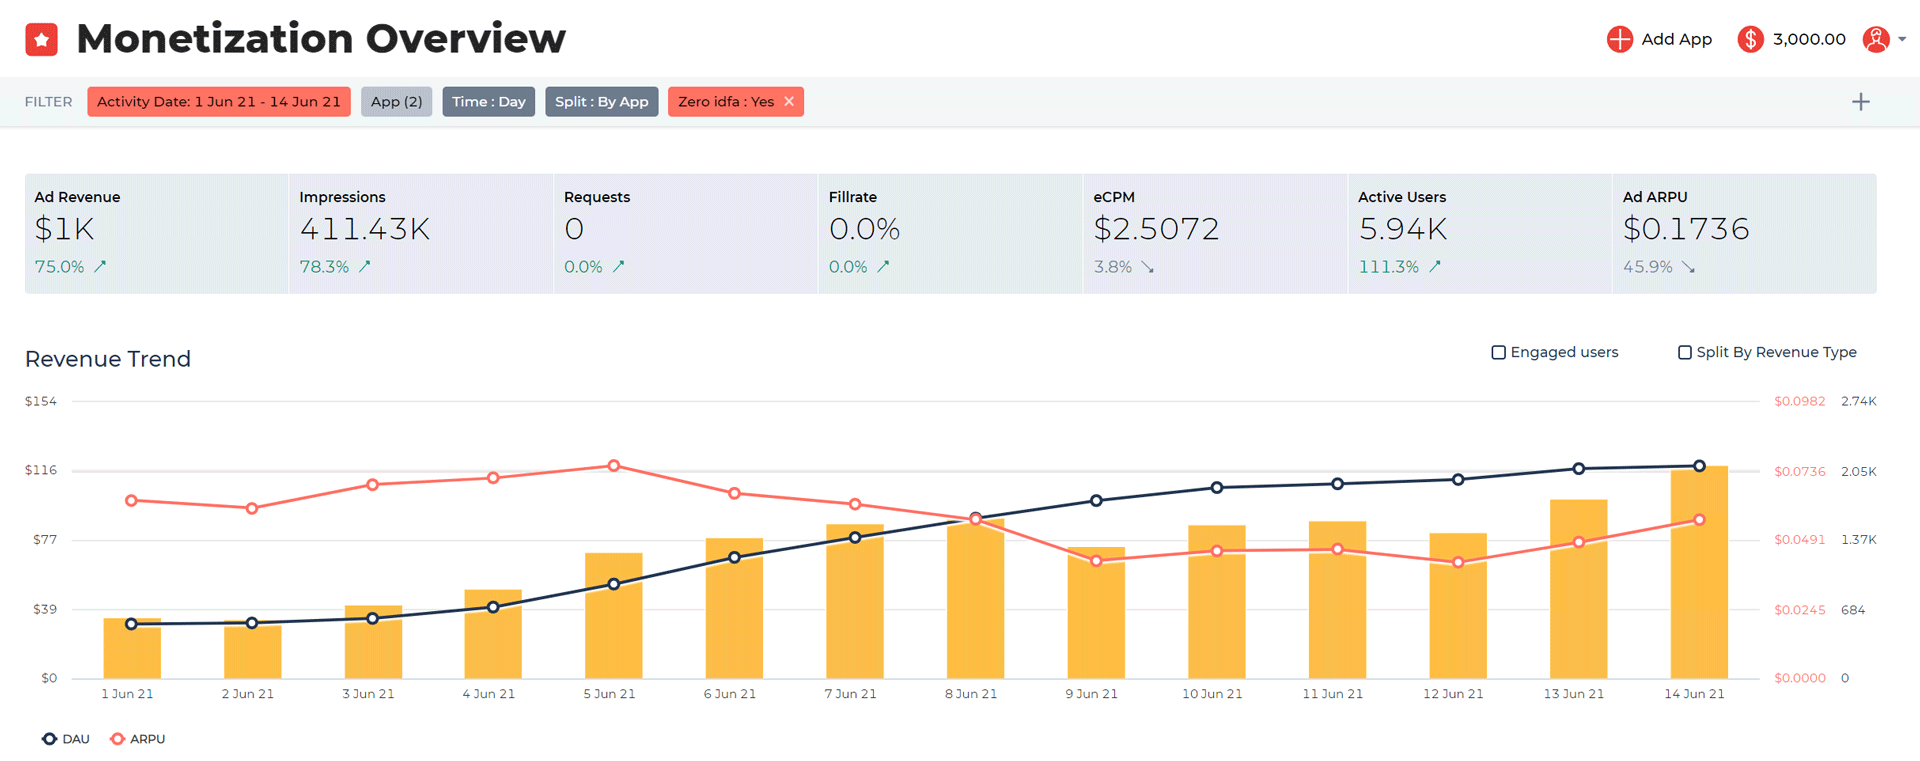
We add this filter to find out the number of active users with zero-IDFA during these last two weeks.
And now we find something! These two trends confirm our IDFA theory:
- First, the number of users with “zero-IDFA = yes” have increased
- While, on the other hand, users with “zero IDFA = no” have decreased.
But let’s not stop here yet. We can still learn more from this situation.
Real Scenario #3: Creating customized reports to find useful insights
Now let’s go to the next tab: your Reports Dashboard.
With this tool, you can create user reports in seconds. Click and drop any metrics or elements, and build detailed reports. This is one of the easiest ways to find out what you have to do next to keep increasing your revenues.
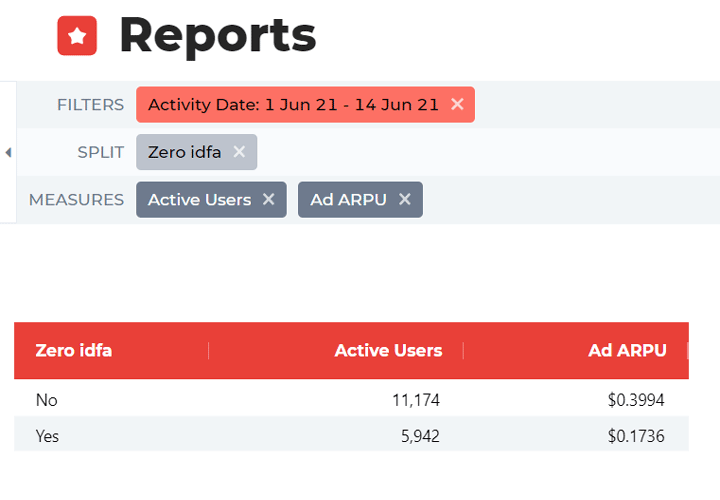
Following the previous example on how the new IDFA policies on iOS affected the revenue... Let’s check the metric “Zero IDFA” and measure how it affected our “Ad ARPU”, and our “Active Users”.
The first thing we can see is that the number of users with “Zero IDFA: Yes” is two times lower than “Zero IDFA - No”. And if you want a more detailed report, you can choose to see it as a graph, instead of a table.
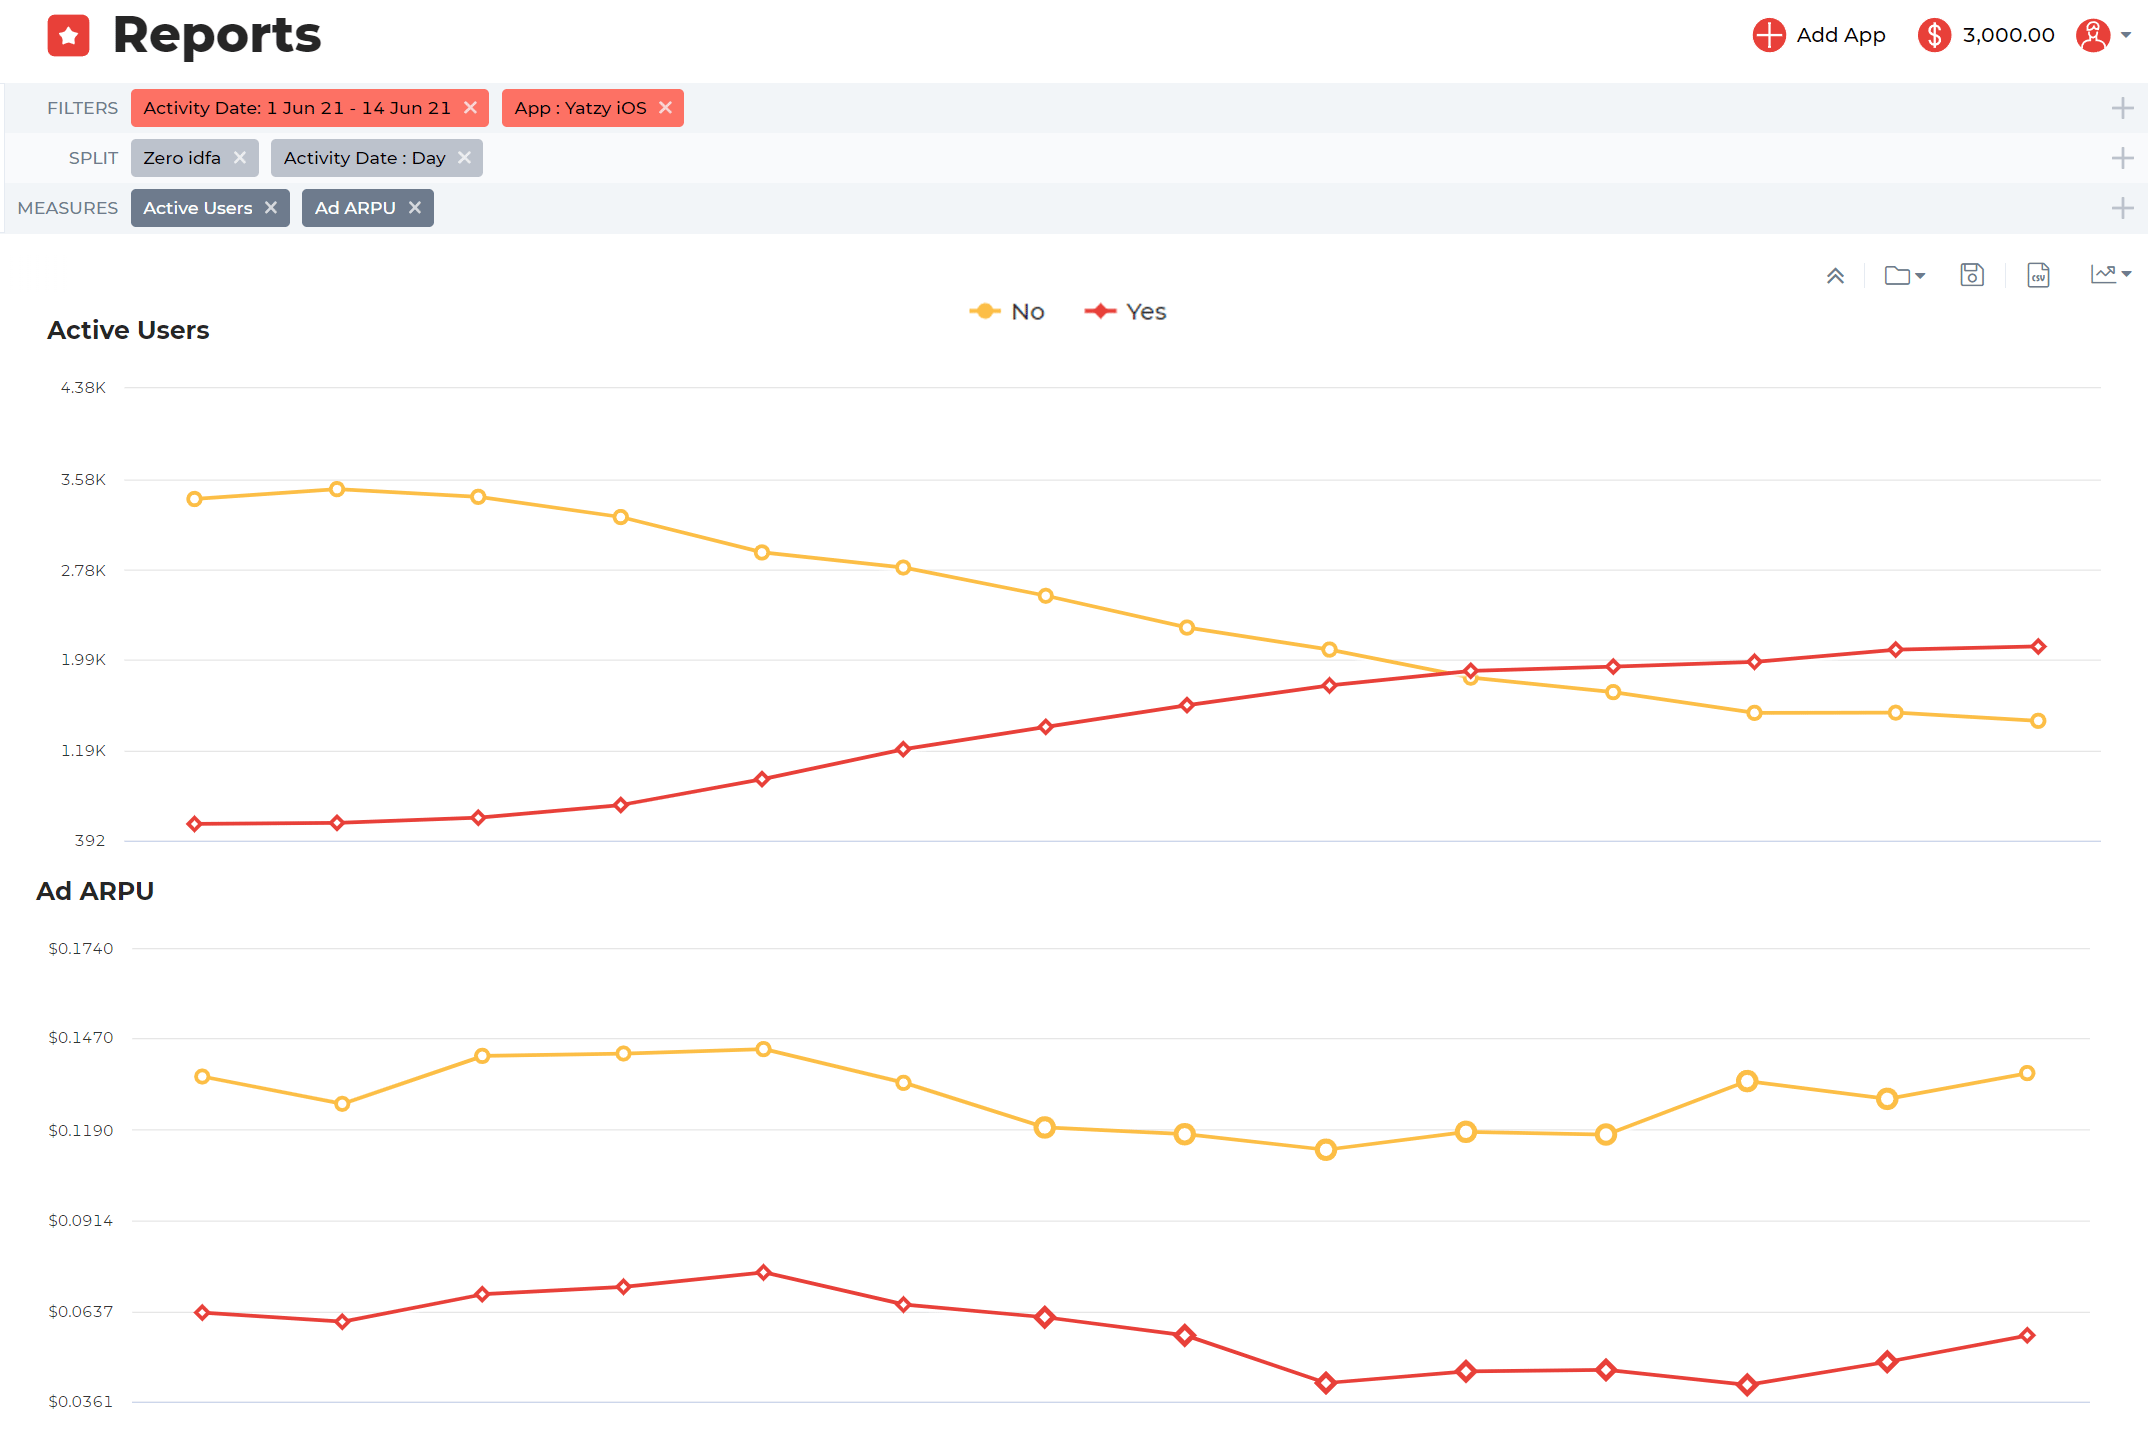
We add a split on time, and here it is!
At the beginning of the week, more than 90% of our active users were not “zero IDFA”. But as the days passed, the number of “Zero IDFA” users increased, and THIS caused the drop in your ad revenue.
All the Info you Need, in no time
With this information in your hands, now you know where you have to put your focus. And this is just one quick example of what you can do with the new Appodeal Dashboards.
Now you can build better and more detailed Reports:
- From “Ad Reports” to analyze your metrics deep down, up to your ad units.
- To “In-App Reports” to analyze your behavioral metrics & game KPIs.
Do you want to filter your statistics by active or inactive users? Done!
Wanna split your graphs by revenue type to better understand your hybrid monetization? Done!
Wanna distribute your performance in user segments, line items, product cohorts, SDK versions, or non-IDFA users? Done, Done, and Done!
Try out the new Appodeal Dashboards, learn what is happening in your apps and games, and turn them into top-earning hits!
It’s easy. It’s smart. It’s Appodeal.